Visualization of BIND9 logs using Elasticsearch, Kibana and Logstash
Date: January 21, 2021
Introduction
DNS server is an important part of network, which resolves domain names into IP addresses. One of the most popular solutions is BIND9, an open-source DNS server with packages available for many Linux distibutions. On the other hand, Elasticsearch + Logstash + Kibana is a great solution for managing Big Data (filtering, sorting, converting raw logs to JSON and etc.) and its visualization. All these tools can work together and create a reliable system of DNS server with flexible data collection and gathering statistics. In this article I’ll show the process of setting up all the services together and give practical examples, what kind of statistics can be gathered and what questions statistics can give answers on.

As a basic system I’ll use Debian 10.7 without any GUI, ELK Stack will be installed using Docker. Some services will be launched on LAN network address (192.168.0.103/24), since I treat my subnetwork as secure, which means that access of other users to tested unprotected services is forbidden, and I can freely run them on machine’s LAN address.
Step 1. Bind9 server installation
There are 2 ways to install BIND9 server, as a package via apt and as a docker container. I’ll use the first option. Before the installation it’s better to decide, which version of BIND9 you’d like to install. If you’re running Debian 10 (buster), you’ll be offered to install BIND 9.11 (it can be checked via sudo apt policy bind9), which is considered to be “old stable version” in January 2021. However, the latest one is 9.16 (available at buster-backports), and this version has an important improvement for logs time format, and this update will make a lot easier setting up logstash component. BIND9 server (which has the highest priority in sudo apt policy bind9) can be installed by the commands below.
sudo apt update
sudo apt install bind9
After the installation we can check, whether BIND9 connects to root DNS servers to the port 53. If yes, it means that everything works as intended. The tool can be used by running following commands:
sudo apt install net-tools (installing netstat package)
sudo netstat -anotc

Also, this command will help us to undestand, whether BIND9 is listening on port 53.
Proto Recv-Q Send-Q Local Address           Foreign Address         State       Timer

tcp        0      0 192.168.0.103:53        0.0.0.0:*               LISTEN      off (0.00/0/0)
Since DNS server is up and running, we can try to get a response from it. It can be done on the VM with BIND9 as well as on any other devices from the same network.
sudo apt install dnsutils
dig sashabrava.github.io @127.0.0.1 (shows DNS response for sashabrava.github.io server and the request is sent to DNS server server 192.168.0.103)
Dig tool can offer more advanced output, which can be received via command below.
dig +trace sashabrava.github.io @127.0.0.1

; <<>> DiG 9.11.5-P4-5.1+deb10u2-Debian <<>> +trace sashabrava.github.io @127.0.0.1
;; global options: +cmd
.			516746	IN	NS	i.root-servers.net.
.			516746	IN	NS	k.root-servers.net.
.			516746	IN	NS	f.root-servers.net.
.			516746	IN	NS	m.root-servers.net.
.			516746	IN	NS	b.root-servers.net.
.			516746	IN	NS	a.root-servers.net.
.			516746	IN	NS	d.root-servers.net.
.			516746	IN	NS	c.root-servers.net.
.			516746	IN	NS	h.root-servers.net.
.			516746	IN	NS	g.root-servers.net.
.			516746	IN	NS	e.root-servers.net.
.			516746	IN	NS	l.root-servers.net.
.			516746	IN	NS	j.root-servers.net.

;; Received 1125 bytes from 127.0.0.1#53(127.0.0.1) in 0 ms

io.			172800	IN	NS	a0.nic.io.
io.			172800	IN	NS	a2.nic.io.
io.			172800	IN	NS	b0.nic.io.
io.			172800	IN	NS	c0.nic.io.

;; Received 632 bytes from 192.5.5.241#53(f.root-servers.net) in 24 ms

github.io.		86400	IN	NS	dns3.p05.nsone.net.
github.io.		86400	IN	NS	dns2.p05.nsone.net.
github.io.		86400	IN	NS	ns-692.awsdns-22.net.
github.io.		86400	IN	NS	ns-1622.awsdns-10.co.uk.
github.io.		86400	IN	NS	dns1.p05.nsone.net.

;; Received 686 bytes from 65.22.161.17#53(b0.nic.io) in 62 ms

sashabrava.github.io.	3600	IN	A	185.199.108.153
sashabrava.github.io.	3600	IN	A	185.199.109.153
sashabrava.github.io.	3600	IN	A	185.199.110.153
sashabrava.github.io.	3600	IN	A	185.199.111.153
;; Received 113 bytes from 198.51.45.5#53(dns2.p05.nsone.net) in 52 ms
Bind9 server chooses the order of root servers via it’s own algorithm, but the output shoud be similar:
- sending request to root servers, in order to receive DNS servers, responsible for .io zone;
- sending request to .io zone DNS server, in order to get server, responsible for .github.io;
- (not in this case, but happens for some other domains) sending request for github.io DNS server, in order to get which DNS server is responsible for sashabrava.github.io;
- receiving the list of IP addresses, which are responsible for sashabrava.github.io domain.
Step 2. Configuring BIND9
BIND9 is able to collect various logs. Official page describes different logging options (but the path to log files is not corrent for Debian, it should be changed as shown below). The most interesting logs for ELK Stack are client queries, and they (as well as some others logs) can be enabled by editing BIND9 config file via sudo nano /etc/bind/named.conf and adding the lines below (another option is creating additional logs settings file named.conf.logs, just like named.conf.local, named.conf.options, but then the new file should be added as INCLUDE in named.conf)
logging {
     channel default_log {
          file "/var/log/named/default" versions 3 size 20m;
          print-time yes;
          print-category yes;
          print-severity yes;
          severity info;
     };
     channel client_security_log {
          file "/var/log/named/client_security" versions 3 size 20m;
          print-time yes;
          print-category yes;
          print-severity yes;
          severity info;
     };
     channel queries_log {
          file "/var/log/named/queries" versions 600 size 20m;
          print-time yes;
          print-category yes;
          print-severity yes;
          severity dynamic;
     };

     category default { default_log; };
     category client { client_security_log; };
     category security { client_security_log; };
     category queries { queries_log; };
};
BIND9 must have a folder to save logs into. It can be created via commands below.
sudo mkdir -p /var/log/named/
sudo chown -R bind:bind /var/log/named/
sudo systemctl restart bind9
Now, if we run the command dig sashabrava.github.io @127.0.0.1, log about the request should appear in
tail /var/log/named/queries file.
Step 3. Installing ELK Stack
Step 3.1 Install Docker and docker-compose
ELK Stack can be installed 2 ways, via Docker and via apt packages. I’ll install ELK using Docker on the same virtual machine with BIND9. It’s suitable for testing, but for production I’d prefer to separate these services. Docker has great opportunities of exporting containers together with their data, and it makes migration to another server relatively easy.
Docker can be installed on Debian via commands below:
sudo apt-get install apt-transport-https ca-certificates curl gnupg-agent software-properties-common
curl -fsSL https://download.docker.com/linux/debian/gpg | sudo apt-key add -
sudo add-apt-repository "deb [arch=amd64] https://download.docker.com/linux/debian $(lsb_release -cs) stable"
sudo apt-get update
sudo apt-get install docker-ce docker-ce-cli containerd.io
Docker offers a way to check whether installation is correct or not, via command docker run hello-world. In my case docker container can be launched without sudo permissions, in case it’s not working on your system, you can run containers as root or add your user to docker group via command sudo usermod -aG docker $USER and re-logging to the account.
Except for Docker, one more great tool is docker-compose. It allows to run multiple containers by specifying their parameters in single docker-compose.yml file. There are 2 ways to install docker-compose, via pip and as a binary from GitHub. I’ll use the second option (since the first option caused issues with permissions), and it can be done via the command below.
sudo curl -L "https://github.com/docker/compose/releases/download/1.27.4/docker-compose-$(uname -s)-$(uname -m)" -o /usr/local/bin/docker-compose
sudo chmod +x /usr/local/bin/docker-compose
docker-compose --version
I’ll keep all the containers’ configuration files in the ~/elk folder, which can be created via mkdir ~/elk, and all the commands below will be executed from that directory (cd ~/elk).
Step 3.2. Installing Elasticsearch.
Elasticsearch is responsible for keeping data and also works as a search engine. The first install preparations are creating folders and setting their permissions.
mkdir -p elasticsearch/{config,storage}
chown -R 1000:1000 elasticsearch/storage/
Docker runs elasticsearch using uid:gid 1000:1000, and it needs read-write permissions in order to store files there.
I’ll create a special file with the latest version of ELK stack, so that elasticsearch, logstash and kibana will have the same version installed. The command for this is nano .env and the text inside the file should be ELK_VERSION=7.10.1 (where 7.10.1 is current latest ELK version). Except for this, there are 2 main files, responsible for running elasticsearch container.
The first important file, nano elasticsearch/config/elasticsearch.yml, should contain:
cluster.name: "docker-es-cluster"
network.host: 0.0.0.0
discovery.zen.minimum_master_nodes: 1
discovery.type: single-node
logger.level: DEBUG
As you can see, I’ve launched the service on 0.0.0.0, not just on localhost. It’s necessary for testing in my case, since VM doesn’t have GUI and I’d like to take a look at some parameters using Firefox. In the production unencrypted services should be run only on localhost or just inside internal Docker network.
The main file for docker-compose is nano docker-compose.yml. As you can see below, this file defines mounted volumes, various containter parameters and etc.
version: '3'
services:
  elasticsearch:
     container_name: elasticsearch_1
     image: docker.elastic.co/elasticsearch/elasticsearch-oss:${ELK_VERSION}
     volumes:
       - ./elasticsearch/config/elasticsearch.yml:/usr/share/elasticsearch/config/elasticsearch.yml
       - ./elasticsearch/storage:/usr/share/elasticsearch/data:rw

     ports:
       - "9200:9200"

     environment:
       - ELASTIC_PASSWORD="elasticpassword"
       - ES_JAVA_OPTS=-Xms512m -Xms512m
       - discovery.type=single-node
       - bootstrap.memory_lock=true
       - http.cors.allow-origin=*

     ulimits:
       memlock:
         soft:  -1
         hard:  -1
     networks:
       - elk
I’ve used elasticsearch-oss, which is a completely open-source version without X-Pack. However, you’re free to install usual Elastisearch, which isn’t completely open-source, but it’s extended by X-Pack free and paid extensions.
Additionally we should define the network section in docker-compose.yml. I should note, that all the services, which will be described later, should be added into services section, before networks.
networks:
   elk:
     driver: bridge
Now the container can be built and started.
docker-compose up -d
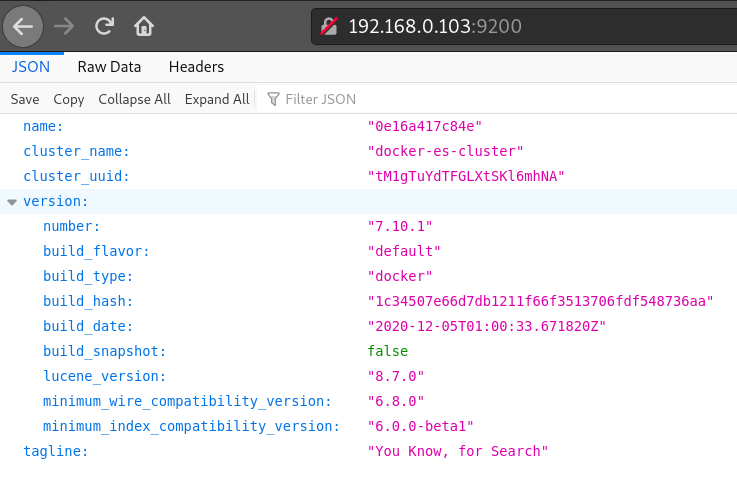
Each time you make changes to docker-compose.yml file, it’s necessary to re-run the last command in order to apply the changes for running containers. As for now, Elasticsearch container has started, and access can be received via web browser or curl http://127.0.0.1:9200/ Among the useful links is also curl http://127.0.0.1:9200/_cat/indices?v, which shows all available data sources and the amount of documents inside inside each of them.
Step 3.3. Installing logstash
Logstash is responsible for receiving logs, filtering, changing their format and sending them to elasticsearch. In order to create the container, we need to create necessary folders via mkdir -p logstash/{config,pipeline,logfile}. File nano logstash/Dockerfile should contain:
ARG ELK_VERSION
FROM docker.elastic.co/logstash/logstash-oss:${ELK_VERSION}
If there is a need to install logstash plugin, it can be specified in the logstash/Dockerfile, for example RUN logstash-plugin install logstash-input-beats. File nano logstash/config/logstash.yml will contain only one line, http.host: "0.0.0.0" (may be changed to 127.0.0.1 if service shouldn’t accept any connections via it’s IP, for example 192.168.0.103/24).
In order to receive logs and send them to elasticsearch, we need to define pipelines. Logs can be received from file (logstash will track file changes), via tcp or udp port, or via the port and input plugin (for example, syslog or beats). I’ll create 2 demonstration pipelines: the first one, 01.test.conf will listen to tcp port 5000 and print to container logs all the incoming data, and second pipeline, 02.dns.conf (described in Step 4), will accept logs from /var/logs/named/queries file of BIND9 and print them both to the container logs and elasticsearch server.
File nano logstash/pipeline/01.test.conf:
input {
  tcp {
    port => 5000
    }
  }
output {
  stdout {
    }
  }
File nano logstash/config/pipelines.conf:
- pipeline.id: test
  path.config: "/usr/share/logstash/pipeline/01.test.conf"
The last step before container creation is adding following lines to docker-compose.yml, to services section:
  logstash:
     container_name: logstash_1
     build:
        context: logstash
        args:
          ELK_VERSION: $ELK_VERSION
     volumes:
       - ./logstash/config/logstash.yml:/usr/share/logstash/config/logstash.yml
       - ./logstash/config/pipelines.yml:/usr/share/logstash/config/pipelines.yml
       - ./logstash/pipeline:/usr/share/logstash/pipeline
     ports:
       - "5000:5000/tcp"
     networks:
       - elk
     depends_on:
       - elasticsearch
Now the container can be built via docker-compose build logstash and launched via docker-compose up -d. As you can see, this container is built differently that Elasticsearch, via Dockerfile (not by setting up image parameter in docker-compose.yml file).
Command docker logs logstash_1 -f will show logs and follow them (until pressed Ctrl+C). Simple way to check the first pipeline is running curl http://127.0.0.1:5000 -XGET, which will send HTTP request on this port, and container logs output (docker logs logstash_1 -f) will show:
{
      "@version" => "1",
    "@timestamp" => 2021-01-17T16:16:28.996Z,
          "host" => "gateway",
          "port" => 41582,
       "message" => "Host: 127.0.0.1:5000\r"
}
{
      "@version" => "1",
    "@timestamp" => 2021-01-17T16:16:28.997Z,
          "host" => "gateway",
          "port" => 41582,
       "message" => "Accept: */*\r"
}
{
      "@version" => "1",
    "@timestamp" => 2021-01-17T16:16:28.979Z,
          "host" => "gateway",
          "port" => 41582,
       "message" => "GET / HTTP/1.1\r"
}
We can see that logstash is up and running, and it’s further, more complicated configuration will be described later.
Step 3.4 Installing Kibana
Kibana is a GUI, which visualizes logs works as a user-friendly interface. Container creation will start from creating directory mkdir -p kibana/config.
Another step is creating nano kibana/config/kibana.yml with the following text:
server.name: kibana
server.host: "0.0.0.0"
elasticsearch.hosts: http://elasticsearch:9200
The last step before container creation is adding following lines to docker-compose.yml, to the services section.
  kibana:
     container_name: kibana_1
     image: docker.elastic.co/kibana/kibana-oss:${ELK_VERSION}
     volumes:
       - ./kibana/config/:/usr/share/kibana/config
     ports:
       - "5601:5601"
     environment:
       - ELASTICSEARCH_PASSWORD="elasticpassword"
     networks:
       - elk
     depends_on:
       - elasticsearch
Now container can be launched via docker-compose up -d.
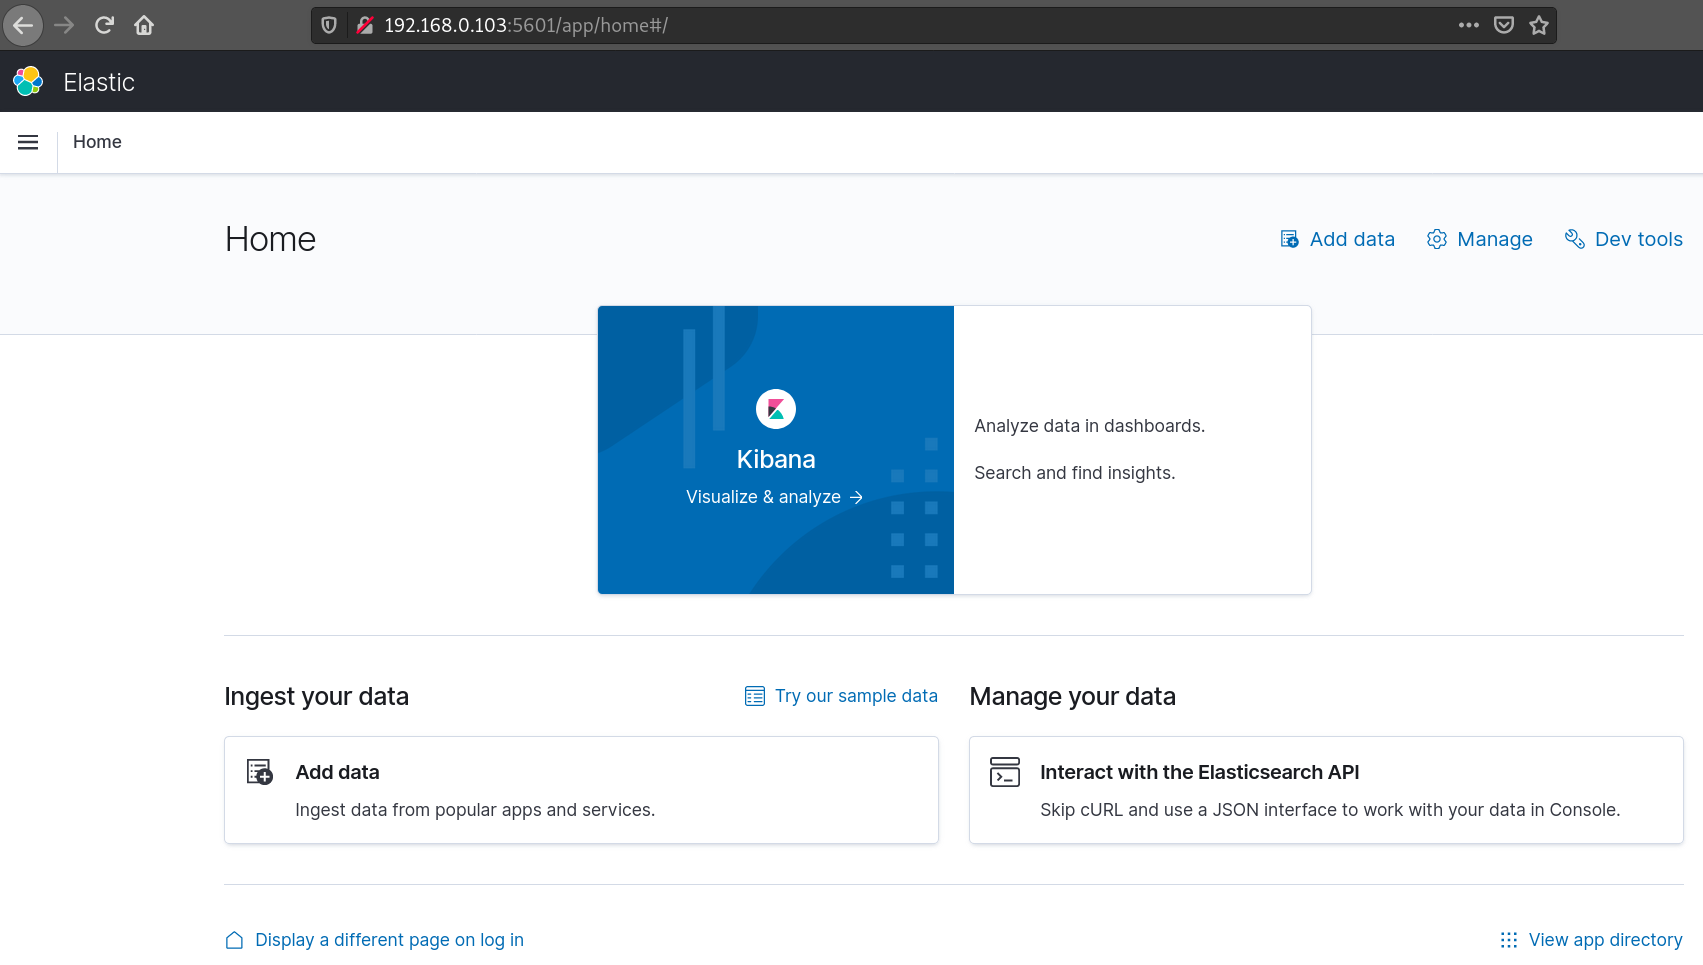
App web interface looks like this. However, if you’re using regular kibana (not kibana-oss), the variety of menus will be much bigger.
Step 4. Advanced instegration of BIND9 and ELK.
Step 4.1. Create pipeline and send raw data to Elasticsearch
Now it’s time to intergrate logstash and bind9. If ELK is setup at the same machine as BIND9, we can simply read the log file and track changes there. If ELK is installed on another VM, it’s possible to send logs via rsyslog onto the opened port of logstash. In my case the machine is the same, and the pipeline, sudo nano logstash/pipeline/02.dns.conf should look like this:
input {
  file {
    path => "/logs/queries"
    }
  }
output {
  stdout {
    }
 elasticsearch {
    hosts => ["http://elasticsearch:9200"]
    index => "raw-bind9-%{+YYYY.MM.dd}"
    }
  }
What exeactly will this pipeline do? It will read the log file of BIND9 and send the output both to the stdout (container logs) and to the elasticsearch. In order to add this pipeline to logstash, we should add it to nano logstash/config/pipelines.conf, as a pipeline with new path.id and path.config:
- pipeline.id: dns
  path.config: "/usr/share/logstash/pipeline/02.dns.conf"
Logstash Docker container still doesn’t have read access to Bind9 log file, it can be fixed by mounting the filestorage to nano docker-compose.yml, to the services -> logstash -> volumes section:
- /var/log/named:/logs:ro
Later we should run docker-compose up -d to apply changes and docker logs logstash_1 -f to view logs. If I make a DNS request to the server (dig sashabrava.github.io @127.0.0.1), I will see the following message in the logstash_1 log:
{
      "@version" => "1",
          "path" => "/logs/queries",
       "message" => "17-Jan-2021 20:32:14.757 queries: info: client @0xclient_id 127.0.0.1#44110 (sashabrava.github.io): query: sashabrava.github.io IN A +E(0)K (127.0.0.1)",
    "@timestamp" => 2021-01-17T19:32:15.047Z,
          "host" => "host_id"
}
What exactly can we understand from this message? That the client 127.0.0.1 made a request from the port 44110, asking DNS server 127.0.0.1 (last value in brackets) about the hostname sashabrava.github.io , and it happened 17-Jan-2021 20:32:14.757, and logstash received this information 2021-01-17T19:32:15.047Z. Additionally the category of the log is “queries” and the severity level is “info”. As we can see, it’s a plenty of info, but how does it look like in elasticsearch?
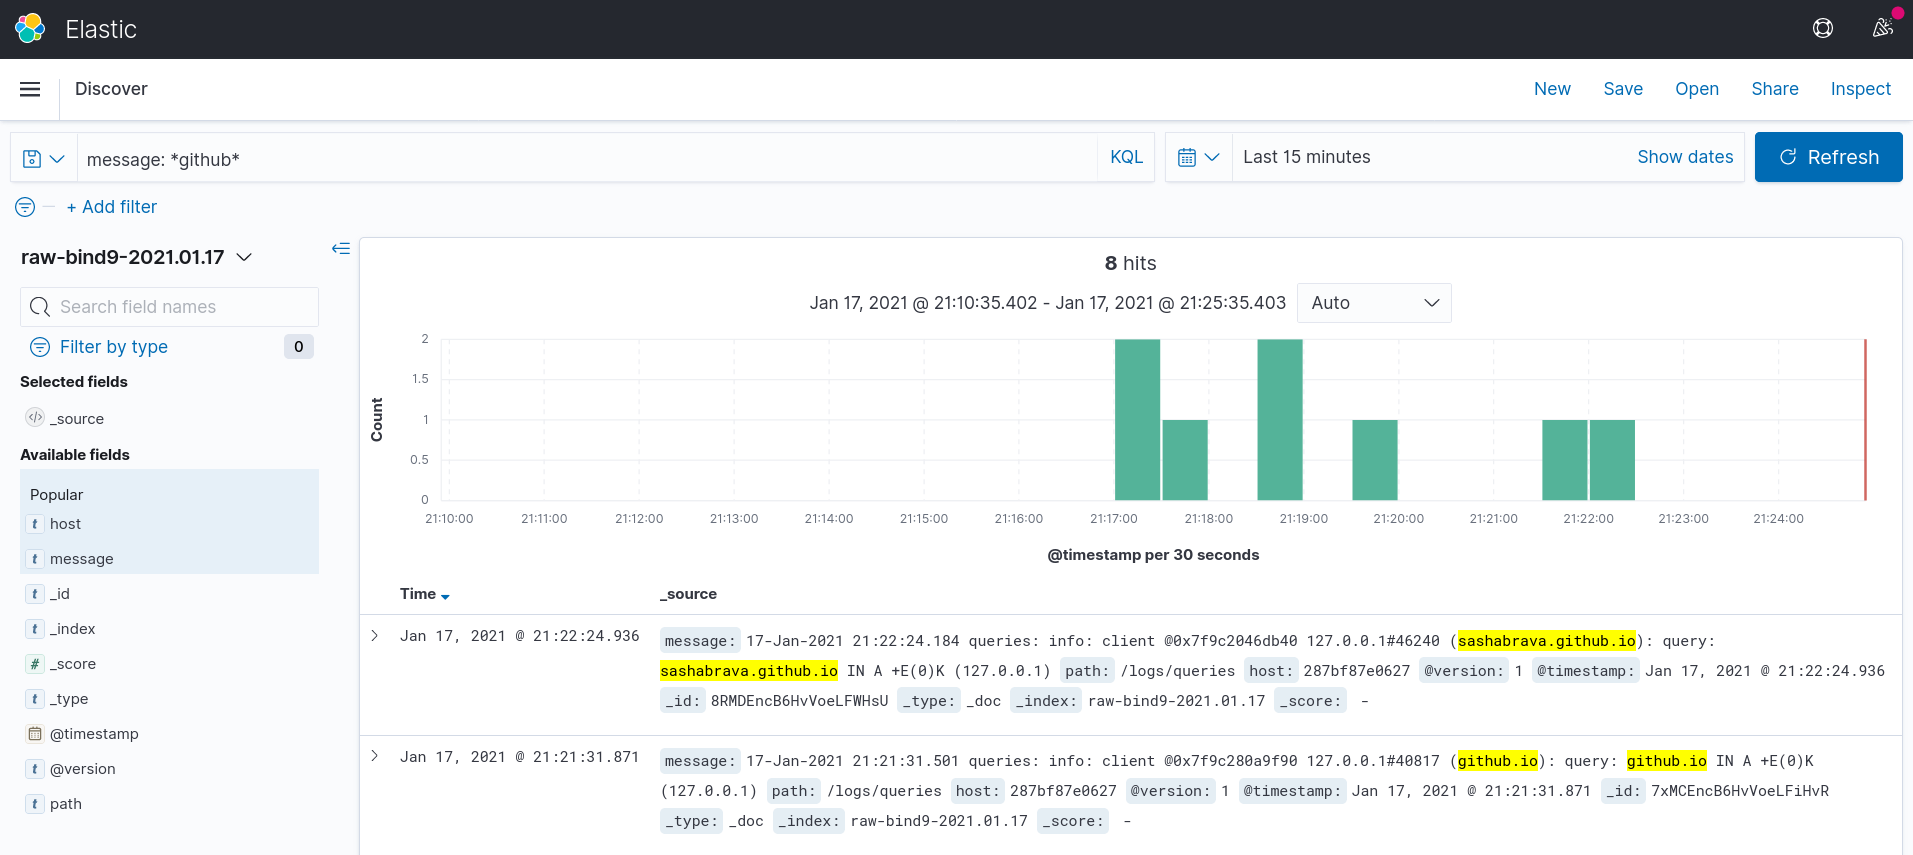
If we run curl http://127.0.0.1:9200/_cat/indices?v, we can see yellow open raw-bind9-2021.01.17. Which means that our data got into Elasticsearch, and now Kibana is able to show it. Yellow (in the curl response) means that data loss is possible, since the Elasticsearch cluster consists of single node.
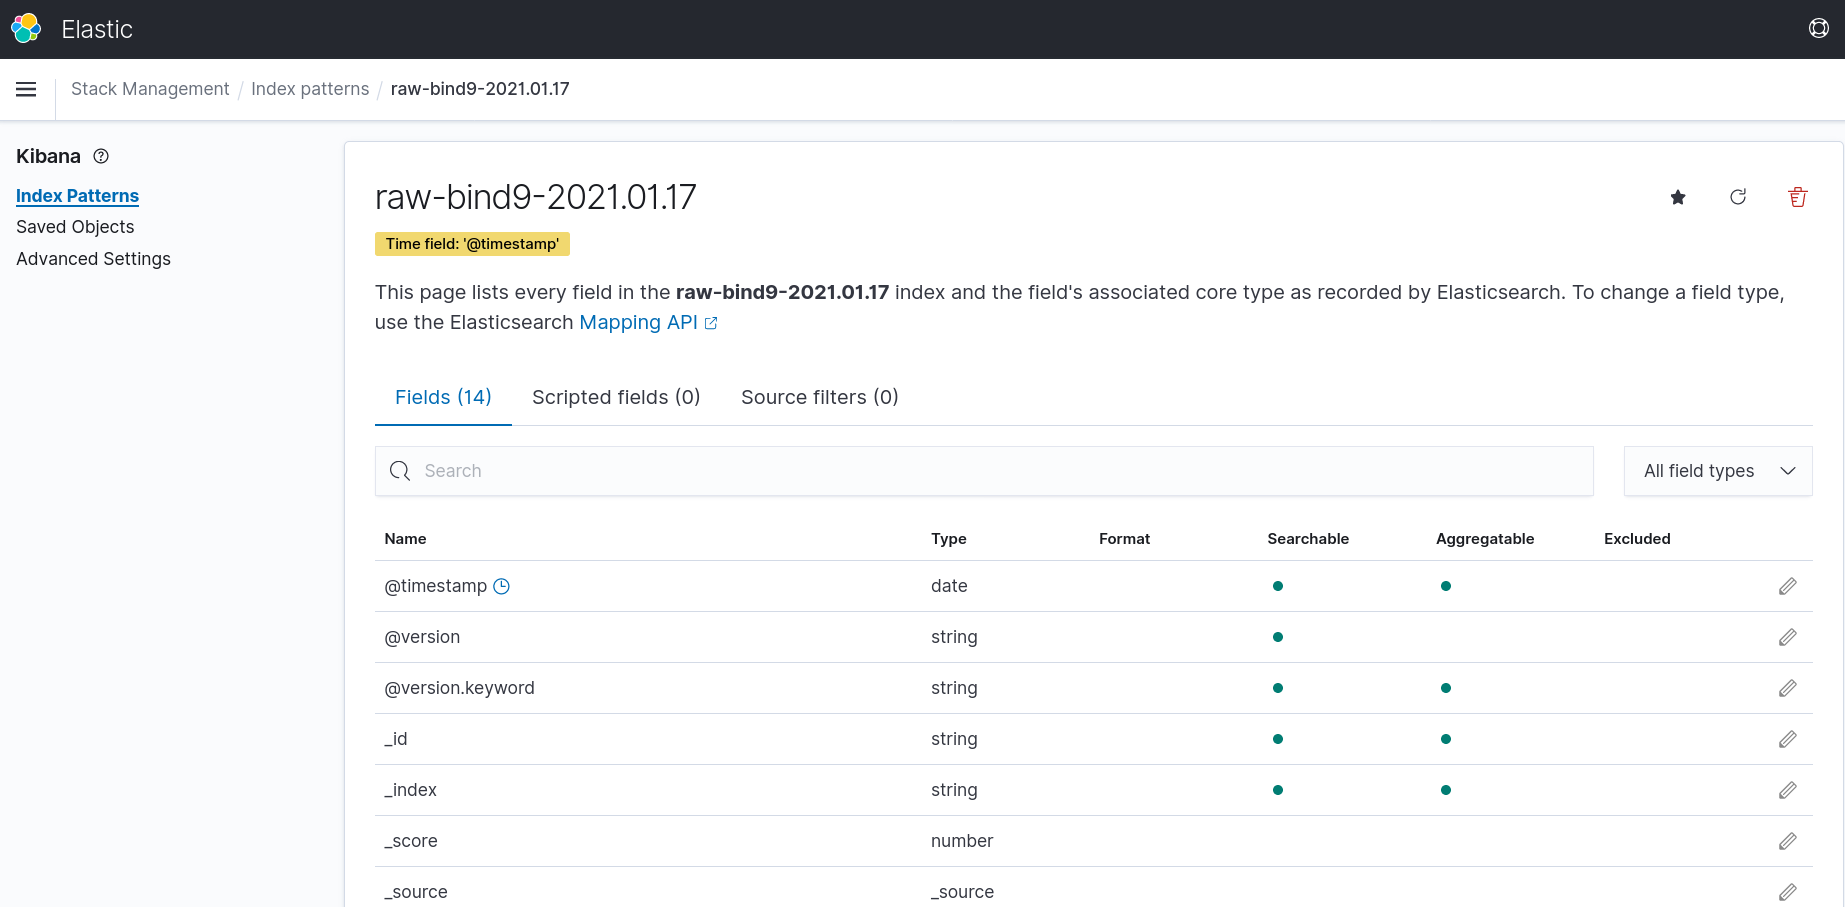
In order to read the data, Kibana needs to have an Index pattern.
And Discover tab will show the data we have.
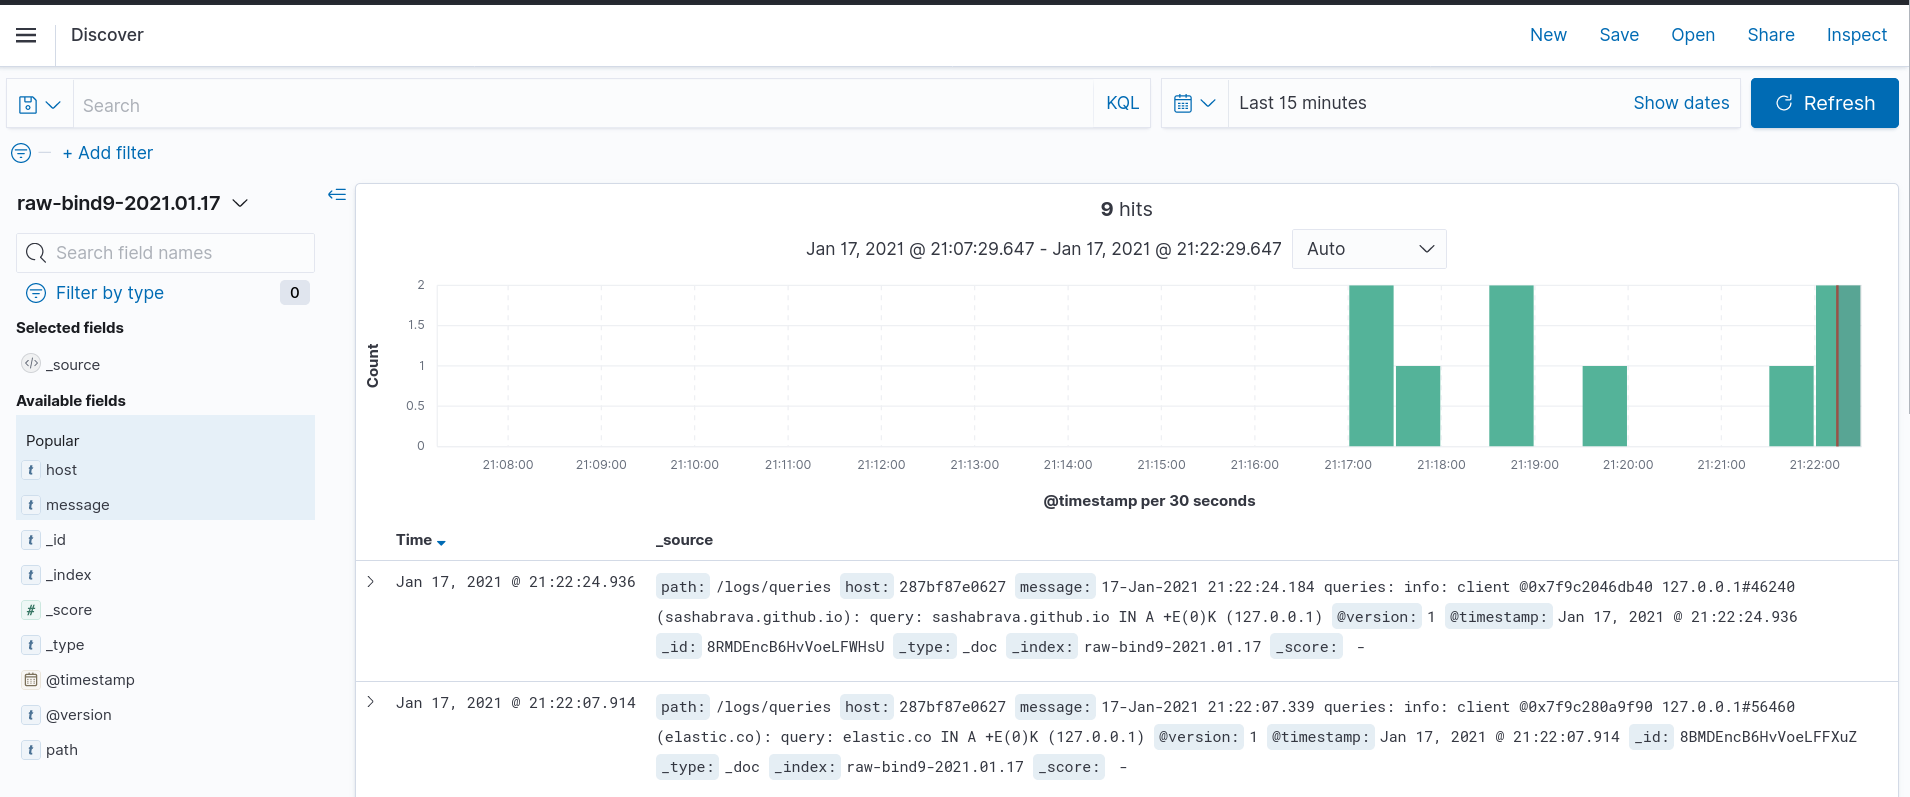
We can filter data, for example I can filter any query, which contained “github” (message: *github* filter). But, as we can see, the data isn’t structured, and we can’t filter queries via client ip, host or any other parameter. In order to do it, we need to define grok section in the pipeline file.
Step 4.1. Defining Grok filter in Logstash pipeline
Grok is a filtering tool, which helps to define, how to convert plain-text log into JSON. File nano logstash/pipeline/02.dns.conf should like this:
input {
  file {
    path => "/logs/queries"
    }
  }
filter {
  grok {
    patterns_dir => ["/opt/logstash/custom_patterns"]
    match => { "message" => "%{BIND9_DATE:EventTime} queries: %{LOGLEVEL:LogLevel}: client %{DATA:ClientID} %{IP:ClientIP}[#]%{NUMBER:ClientPort} \(%{HOSTNAME:Hostname}\)[:] query: %{HOSTNAME:QueryName} %{WORD:QueryClass} %{WORD:QueryType} %{DATA:QueryFlags} \(%{IP:LocalAddress}\)" }

      }
  }
output {
  stdout {
    }
 elasticsearch {
    hosts => ["http://elasticsearch:9200"]
    index => "dns-%{+YYYY.MM.dd}"
    }
  }
Step 4.2. Notes about Grok configuration
Note a: except the pipeline above, we need to create custom BIND9 time pattern. Bind 9.11, the one I used, can’t save logs time in any supported by grok format (for example iso8601), that’s why there needs to be a custom template. Bind 9.16
is able to save logs in correct format, print-time parameter of BIND9 logging channel accepts values iso8601 and iso8601-utc.
File nano logstash/custom_patterns/custom_patterns:
BIND9_DATE %{MONTHDAY}[-]%{MONTH}[-]%{YEAR}[ ]*%{TIME}
In order to mount custom template to the container, we need to add - ./logstash/custom_patterns:/opt/logstash/custom_patterns volume to the nano docker-compose.yml, services -> logstash -> volumes section of the file.
After the changes are applied we should run docker-compose up -d.
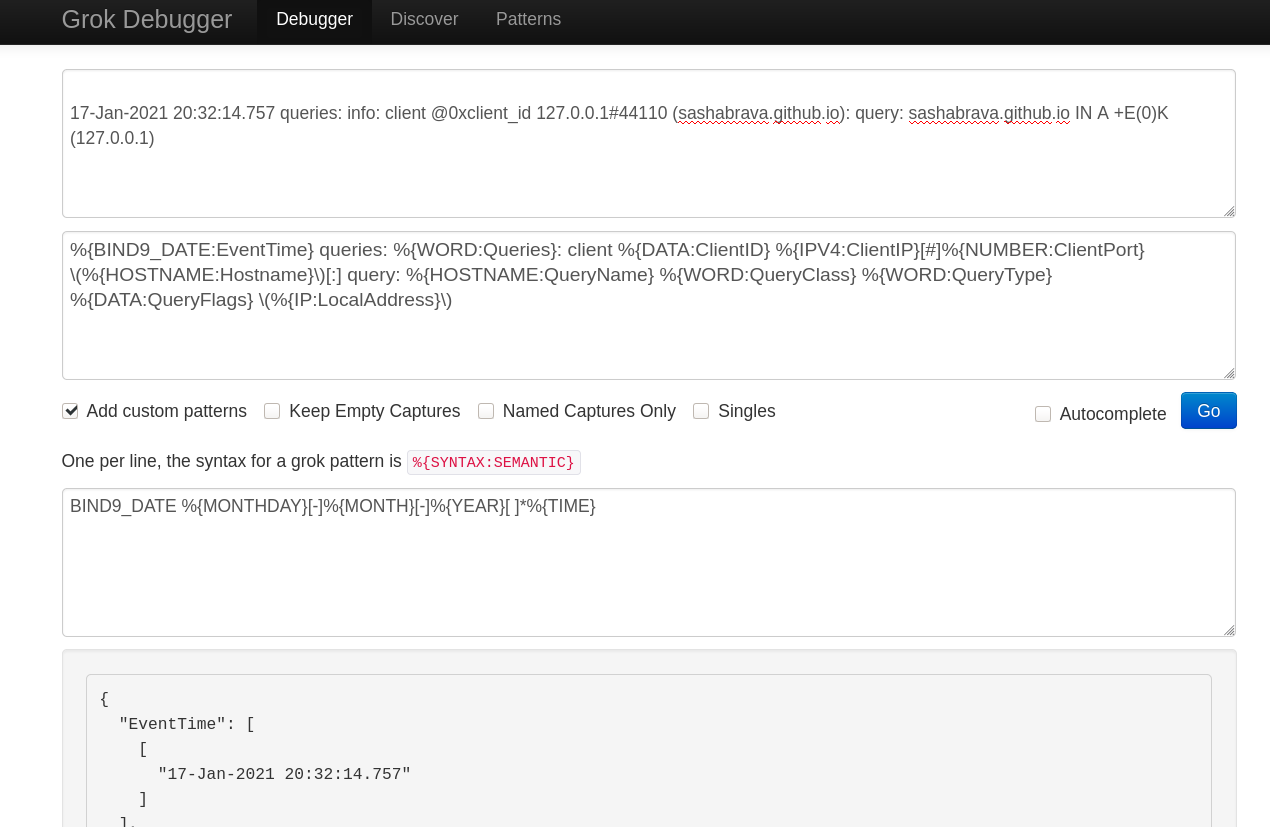
Note b: Grok pattern necessary for your logs file can be different (because of different loggin settings, BIND9 version and etc.). You can check it on https://grokdebug.herokuapp.com/, a service for checking grok patterns. If something is wrong, you will see the message “No matches”.
Note c: If you’d like to remove the data from Elasticsearch indice, the command is curl -X DELETE http://localhost:9200/dns-2021.01.06. Additionally, if you change the format of logs, it’s worth checking (or re-creating) Index pattern in Kibana.
Note d: Elasticsearch indice is different in the pipeline in Step 4, comparing to Step 3, it has changed from raw-bind9-* to dns-*. That’s why the new Index pattern should be created in Kibana, the new pattern is dns-*.
The grok rule, defined in Step 4.1, checks if the log satisfies filter requirement, and if yes, container logs (docker logs logstash_1 -f) will look like this:
{
      "QueryClass" => "IN",
        "@version" => "1",
       "QueryName" => "sashabrava.github.io",
       "EventTime" => "18-Jan-2021 20:31:27.211",
         "message" => "18-Jan-2021 20:31:27.211 queries: info: client @0x7f8ad4239c60 127.0.0.1#36402 (sashabrava.github.io): query: sashabrava.github.io IN A +E(0)K (127.0.0.1)",
        "ClientID" => "@0x7f8ad4239c60",
        "ClientIP" => "127.0.0.1",
            "host" => "287bf87e0627",
      "QueryFlags" => "+E(0)K",
       "QueryType" => "A",
            "path" => "/logs/queries",
      "ClientPort" => "36402",
        "LogLevel" => "info",
    "LocalAddress" => "127.0.0.1",
      "@timestamp" => 2021-01-18T19:31:27.815Z,
        "Hostname" => "sashabrava.github.io"
}
Step 4.3. Grok timestamp
As we can see, the log already has a structured format. But there is a mistake in sudo nano logstash/pipeline/02.dns.conf, EventTime (the time of DNS request) and @timestamp (the time of logstash log receive event) differ. Logstash uses @timestamp in order to filter (or group) requests by date. In order to fix it, we need to make some changes to the filter rule:
filter {
  grok {
    patterns_dir => ["/opt/logstash/custom_patterns"]
    match => { "message" => "%{BIND9_DATE:EventTime} queries: %{LOGLEVEL:LogLevel}: client %{DATA:ClientID} %{IP:ClientIP}[#]%{NUMBER:ClientPort} \(%{HOSTNAME:Hostname}\)[:] query: %{HOSTNAME:QueryName} %{WORD:QueryClass} %{WORD:QueryType} %{DATA:QueryFlags} \(%{IP:LocalAddress}\)" }

      }
  date {
    match => [ "EventTime", "dd-MMM-yyyy HH:mm:ss.SSS"]
    timezone => "Europe/Warsaw"
    }
}
The date section describes where @timestamp should get an information from, and what’s the format of that field. After the container restart (docker restart logstash_1) container logs (docker logs logstash_1 -f) should look like this:
{
    "LocalAddress" => "127.0.0.1",
         "message" => "18-Jan-2021 21:07:37.312 queries: info: client @0x7f8adc0a9e20 127.0.0.1#38745 (sashabrava.github.io): query: sashabrava.github.io IN A +E(0)K (127.0.0.1)",
      "@timestamp" => 2021-01-18T20:07:37.312Z,
       "EventTime" => "18-Jan-2021 21:07:37.312",
            "path" => "/logs/queries",
        "LogLevel" => "info",
        "@version" => "1",
        "ClientIP" => "127.0.0.1",
      "QueryClass" => "IN",
        "Hostname" => "sashabrava.github.io",
       "QueryName" => "sashabrava.github.io",
      "QueryFlags" => "+E(0)K",
            "host" => "287bf87e0627",
      "ClientPort" => "38745",
       "QueryType" => "A",
        "ClientID" => "@0x7f8adc0a9e20"
}
As we can see, now logstash shows correct @timestamp. However, some fields can be deleted from the output, by adding following text to filter section of sudo nano logstash/pipeline/02.dns.conf:
  mutate {
    remove_field => ["path", "host", "@version", "EventTime" ]
    }
Step 4.4. Elasticsearch data types
The last problem is data type. Elasticsearch will read all the fields as text (except @timestamp), and it won’t allow to use all the features of Kibana diagrams (for example we can’t filter data by clients IP range, if the field has text type). In order to fix it, we need to create an Elasticsearch template. In order to get basic template (the one currently used by dns-2021.01.16 indice), we should run following command:
curl -XGET http://127.0.0.1:9200/dns-2021.01.16/_mapping?pretty > dns_mapping.json
Downloaded file can be edited via nano dns_mapping.json, and template should look the following way:
{
  "template": "dns_template",
  "version": 1,
  "settings" : {
    "index.refresh_interval" : "5s"
  },
  "index_patterns": [
    "dns-*"
  ],
  "mappings" : {
      "properties" : {
        "@timestamp" : {
          "type" : "date"
        },
        "ClientID" : {
          "type" : "text",
          "fields" : {
            "keyword" : {
              "type" : "keyword",
              "ignore_above" : 256
            }
          }
        },
        "ClientIP" : {
          "type" : "ip"
        },
        "ClientPort" : {
          "type" : "integer"
        },
        "Hostname" : {
          "type" : "text",
          "fields" : {
            "keyword" : {
              "type" : "keyword",
              "ignore_above" : 256
            }
          }
        },
        "LocalAddress" : {
          "type" : "ip"
        },
        "Queries" : {
          "type" : "text",
          "fields" : {
            "keyword" : {
              "type" : "keyword",
              "ignore_above" : 256
            }
          }
        },
        "QueryClass" : {
          "type" : "text",
          "fields" : {
            "keyword" : {
              "type" : "keyword",
              "ignore_above" : 256
            }
          }
        },
        "QueryFlags" : {
          "type" : "text",
          "fields" : {
            "keyword" : {
              "type" : "keyword",
              "ignore_above" : 256
            }
          }
        },
        "QueryName" : {
          "type" : "text",
          "fields" : {
            "keyword" : {
              "type" : "keyword",
              "ignore_above" : 256
            }
          }
        },
        "QueryType" : {
          "type" : "text",
          "fields" : {
            "keyword" : {
              "type" : "keyword",
              "ignore_above" : 256
            }
          }
        },
        "message" : {
          "type" : "text",
          "fields" : {
            "keyword" : {
              "type" : "keyword",
              "ignore_above" : 256
            }
          }
        }
      }
    }
  }
After the template is edited, it needs to be uploaded to Elasticsearch. The command for this is:
curl -XPUT http://localhost:9200/_template/dns_template?pretty -H 'Content-Type: application/json' -d @dns_mapping.json
Now, if we delete an old Kibana Index pattern and create a new one, the data type will be correct. In case it didn’t happen, remote the data from indice (curl -X DELETE http://localhost:9200/dns-2021.01.16) and create Index pattern again.
Step 5. Configuring Kibana to visualize logs.
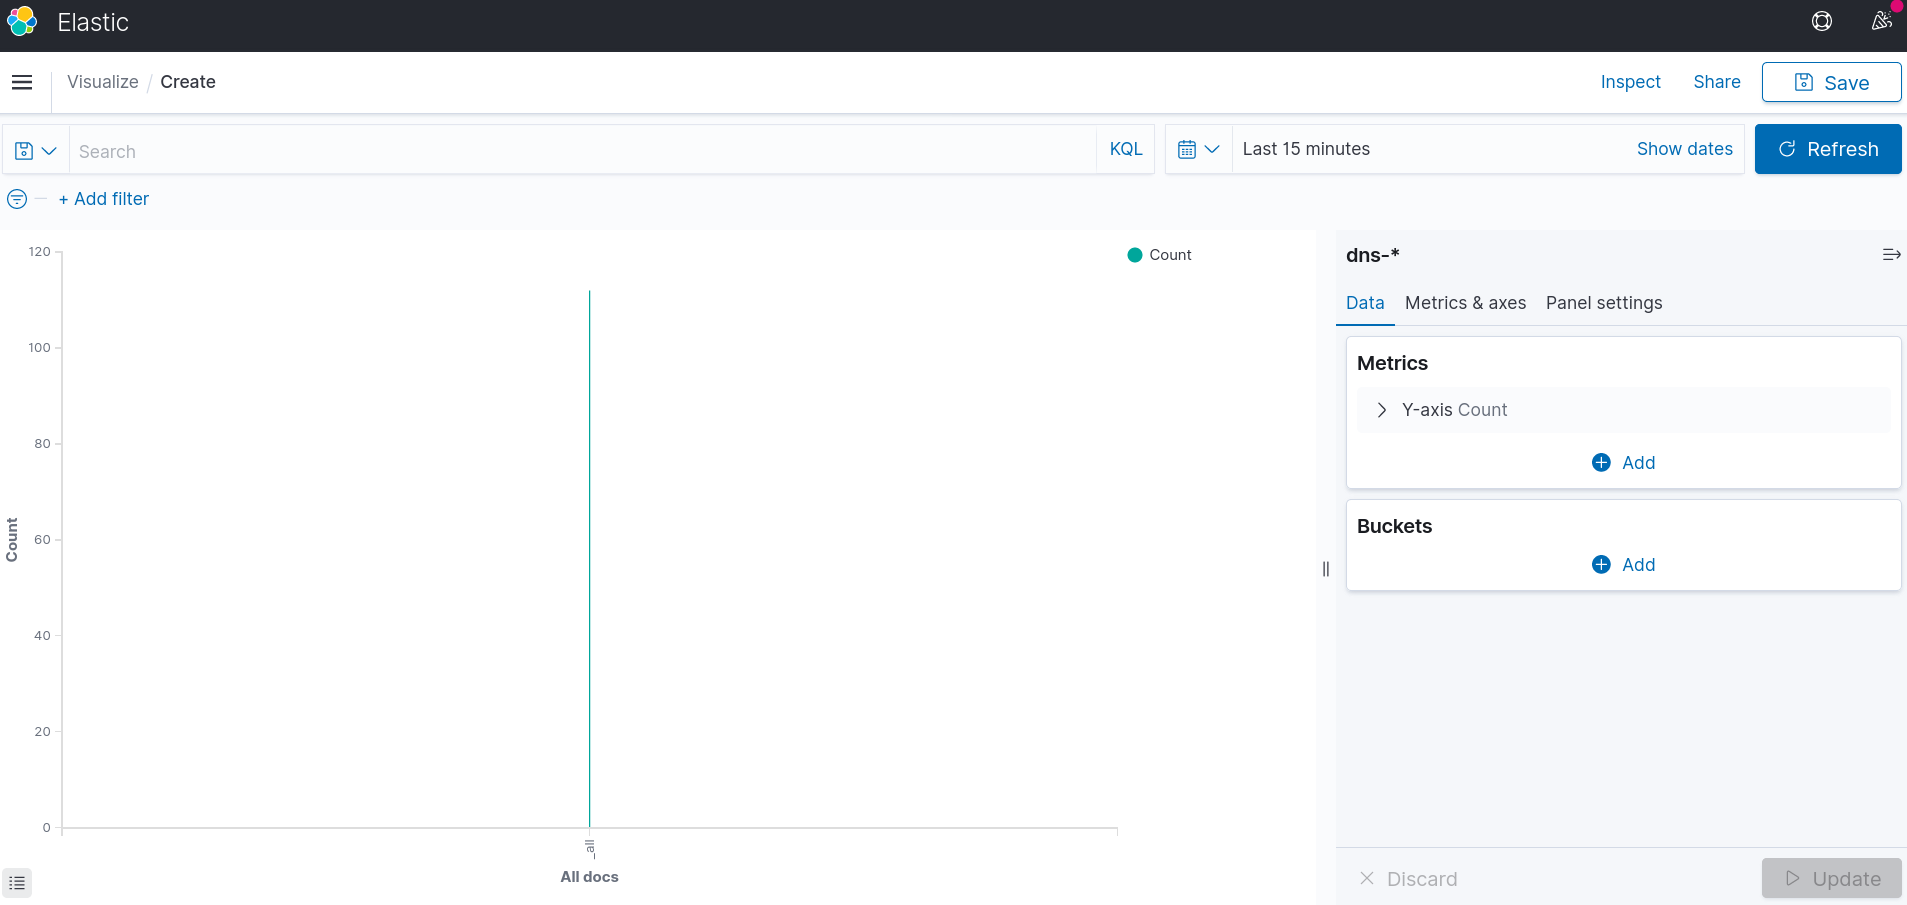
After some data from BIND9 got into Elasticsearch, we can start data visualization. Charts can be created by entering Menu -> Kibana -> Visualize -> Create visualization -> Area. The source data is Index dns-*. Default chart shows the overall amount of DNS requests to DNS server during last 15 minutes.
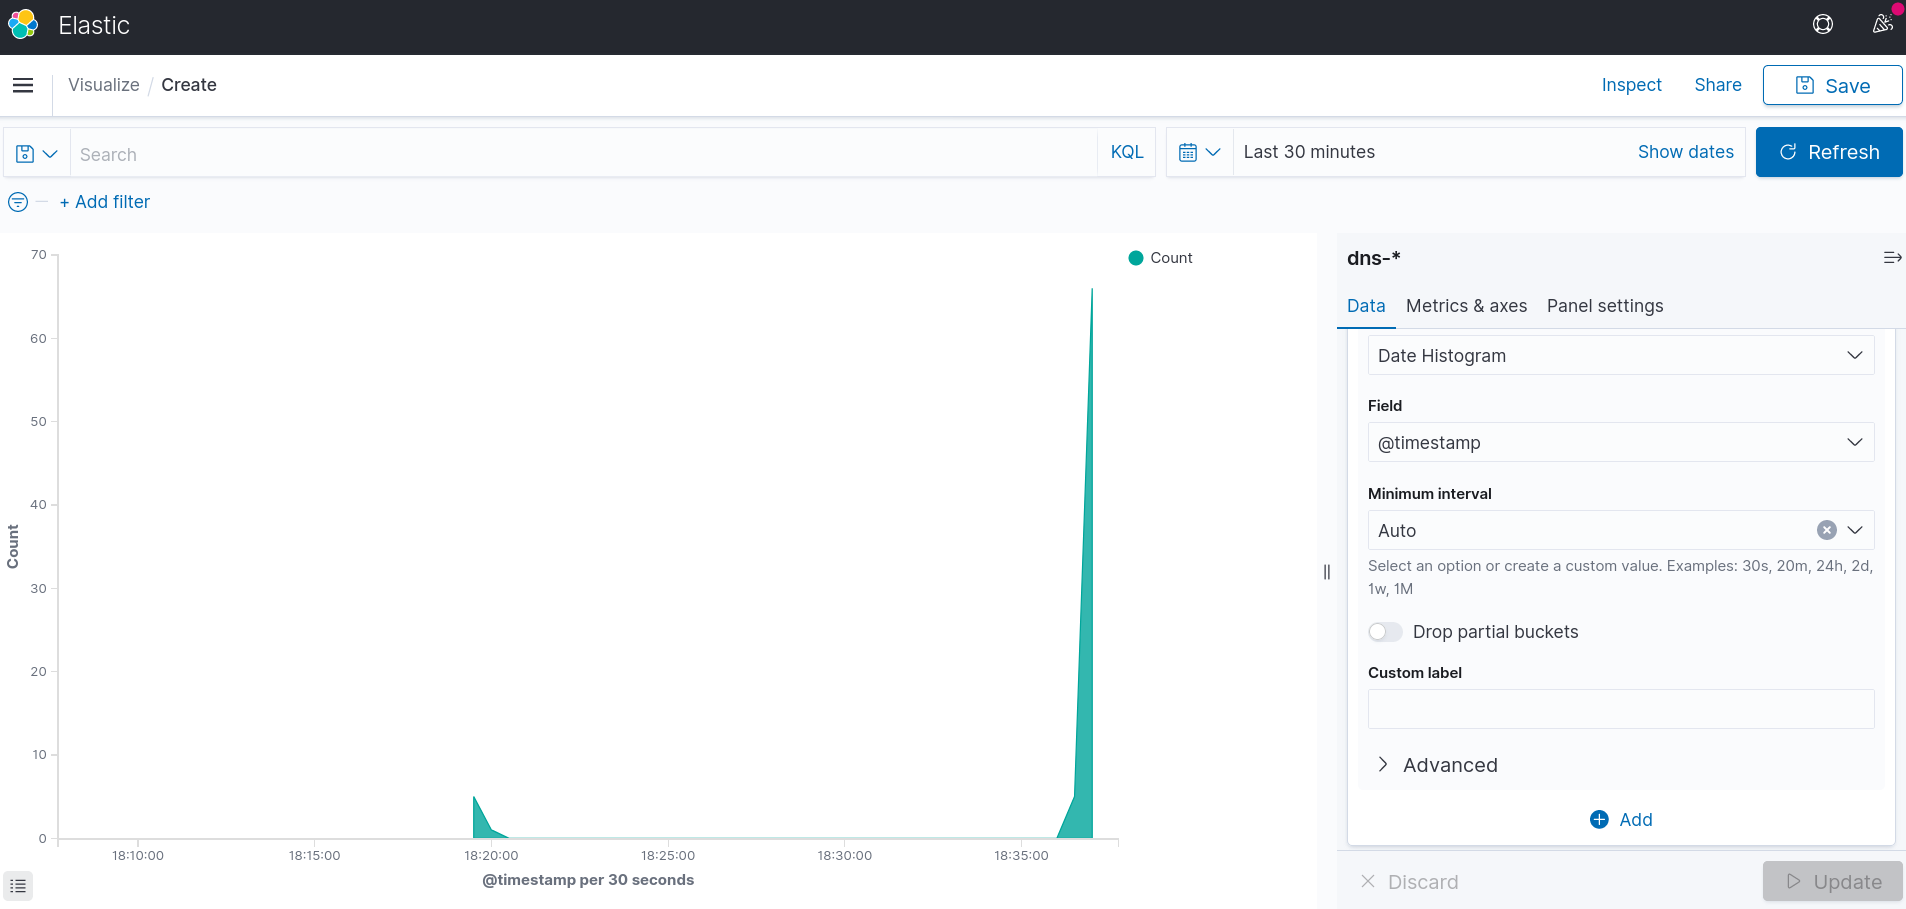
There is an option to set X-axis as timeline. It can be done via Bucket -> X-axis -> Aggregation -> Date Histogram -> Update
In order to get more information from the chart, the Y-axis value can be split as well. It may be important to undestand, which pool of clients makes the most of requests. I’d like to get statistics from 2 pools: 192.168.0.0/24 and 127.0.0.0/8. It can be done via Bucket -> Split series -> IPv4 Range on field ClientIP -> CIDR masks 127.0.0.0/8 and 192.168.0.0/24 -> Update
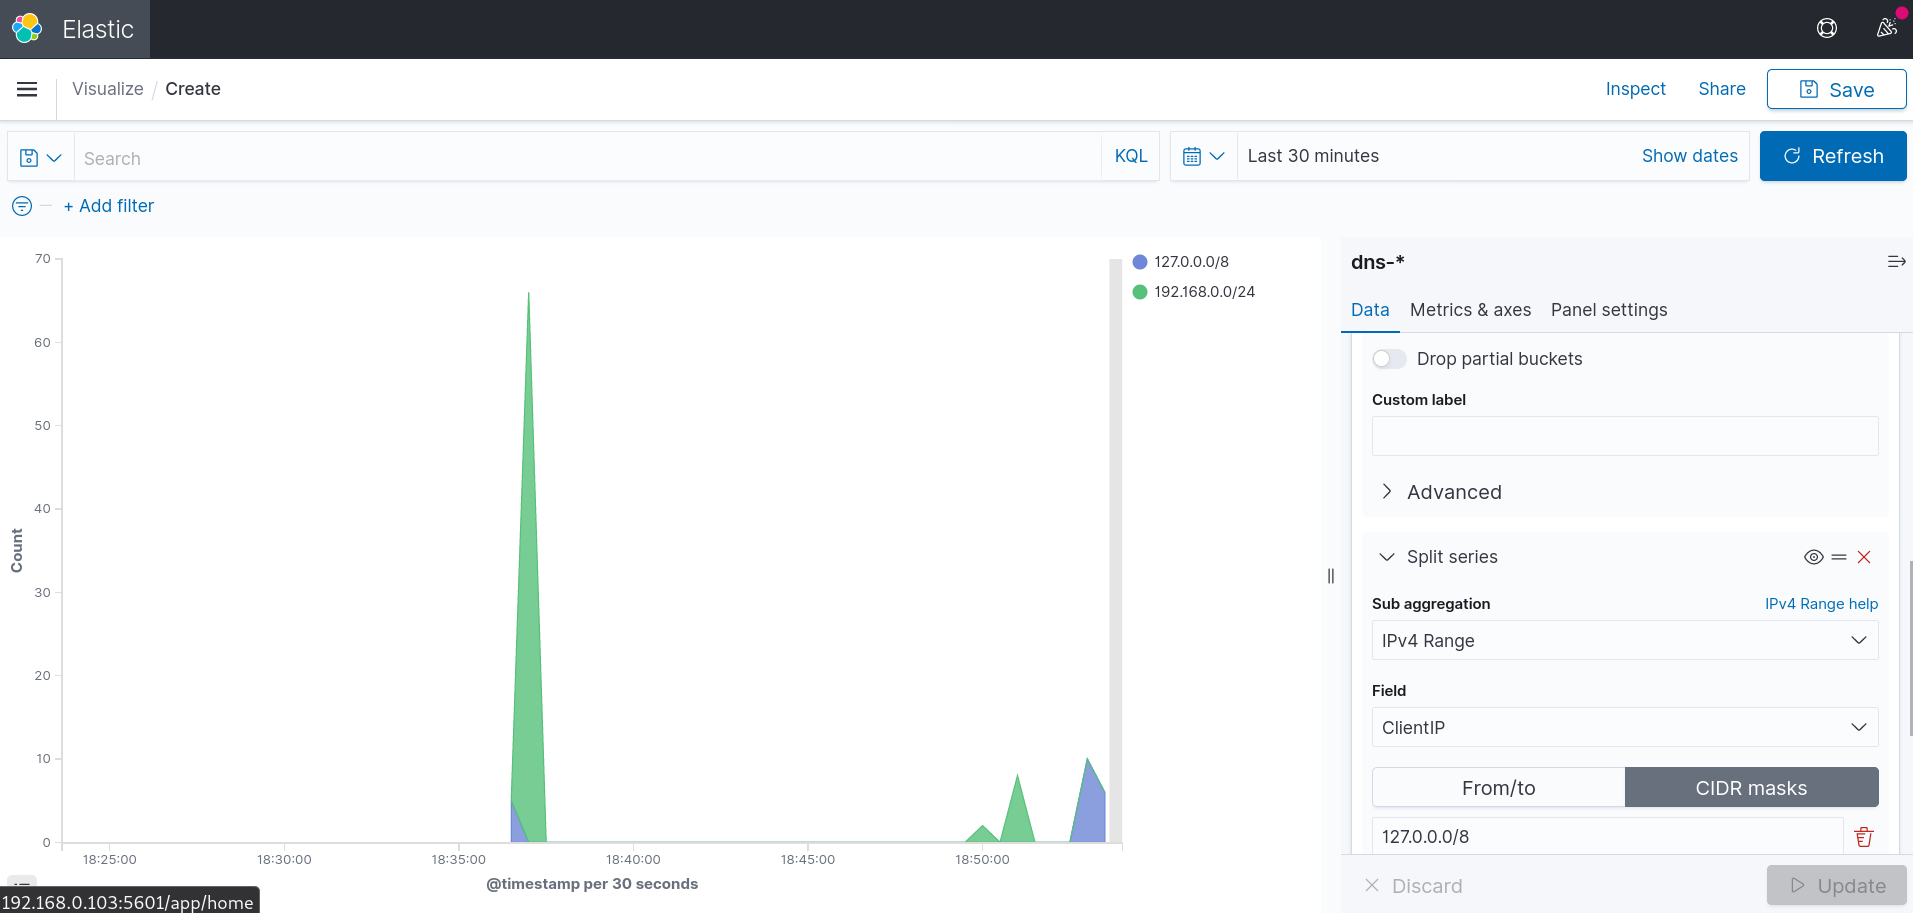
After the chart is created, it should be saved, otherwise all the changes will be lost.
When there are many charts created, it makes sens to group them. Creating various dashboards is one of the options. Menu -> Dashboards -> Create new dashboard -> Add an existing or new item. I’ve added one more chart (pie) with 2 metrics: most popular DNS requests and proportion of requests on each server interface (127.0.0.1 and 192.168.0.103). Dashboard must be saved as well, otherwise changes will be lost.
Important steps before running service in production
- Changing elasticsearch password in
docker-compose.yml; - Setting docker-compose autostart (by creating service in
/etc/systemd/system/folder); - Password protection of ELK by running nginx/apache2 reverse proxy with authorization and disabling host 0.0.0.0 everywhere in the ELK Stack;
- Separating BIND9 server from ELK Stack;
- Setting single Logstash pipeline to accept logs from different devices using one external port;
- Disabling Logstash pipeline stdout output (output to the container logs)
- Setting up Elasticsearch cluster.